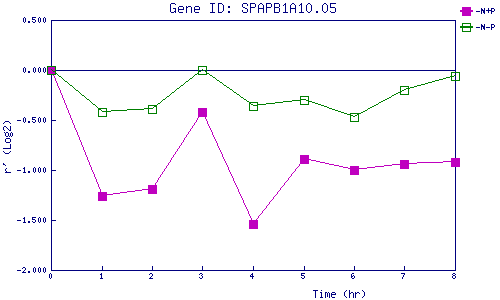
| 0 | 1 | 2 | 3 | 4 | 5 | 6 | 7 | 8 | |
| -N+P | 0.000 | -1.259 | -1.193 | -0.418 | -1.535 | -0.892 | -0.997 | -0.939 | -0.922 |
| -N-P | 0.000 | -0.424 | -0.389 | -0.002 | -0.363 | -0.297 | -0.474 | -0.199 | -0.058 |
|
-N+P: Nitrogen starved in the presence of P-factor -N-P: Nitrogen starved in the absence of P-factor |