| 0 | 1 | 2 | 3 | 4 | 5 | 6 | 7 | 8 | |
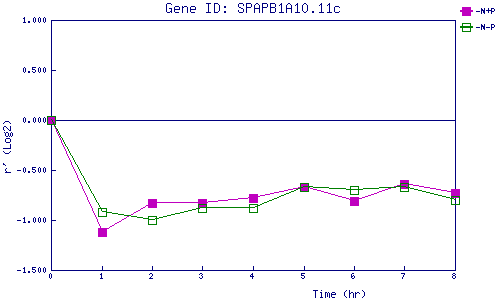
| -N+P | 0.000 | -1.115 | -0.831 | -0.826 | -0.778 | -0.674 | -0.810 | -0.638 | -0.726 |
| -N-P | 0.000 | -0.924 | -0.996 | -0.876 | -0.881 | -0.673 | -0.697 | -0.671 | -0.805 |
|
-N+P: Nitrogen starved in the presence of P-factor -N-P: Nitrogen starved in the absence of P-factor |