| 0 | 1 | 2 | 3 | 4 | 5 | 6 | 7 | 8 | |
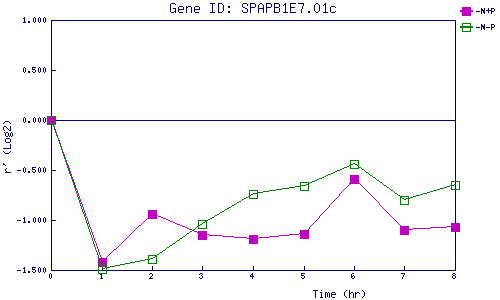
| -N+P | 0.000 | -1.416 | -0.944 | -1.149 | -1.193 | -1.142 | -0.588 | -1.101 | -1.073 |
| -N-P | 0.000 | -1.493 | -1.388 | -1.043 | -0.745 | -0.664 | -0.444 | -0.800 | -0.650 |
|
-N+P: Nitrogen starved in the presence of P-factor -N-P: Nitrogen starved in the absence of P-factor |