mcl1
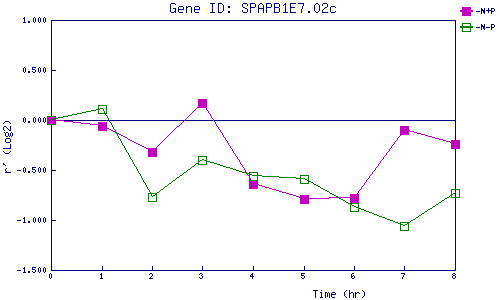
| 0 | 1 | 2 | 3 | 4 | 5 | 6 | 7 | 8 | |
| -N+P | 0.000 | -0.063 | -0.318 | 0.172 | -0.640 | -0.786 | -0.781 | -0.099 | -0.242 |
| -N-P | 0.000 | 0.106 | -0.770 | -0.395 | -0.558 | -0.589 | -0.869 | -1.055 | -0.728 |
|
-N+P: Nitrogen starved in the presence of P-factor -N-P: Nitrogen starved in the absence of P-factor |