| 0 | 1 | 2 | 3 | 4 | 5 | 6 | 7 | 8 | |
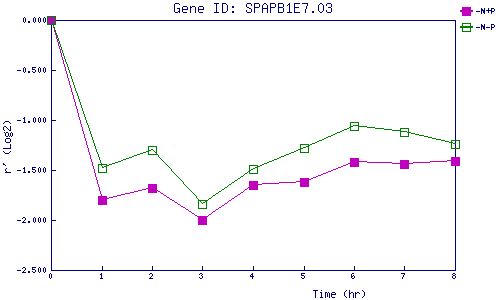
| -N+P | 0.000 | -1.799 | -1.679 | -2.001 | -1.652 | -1.617 | -1.415 | -1.440 | -1.414 |
| -N-P | 0.000 | -1.479 | -1.305 | -1.836 | -1.486 | -1.285 | -1.064 | -1.119 | -1.240 |
|
-N+P: Nitrogen starved in the presence of P-factor -N-P: Nitrogen starved in the absence of P-factor |