rpc17
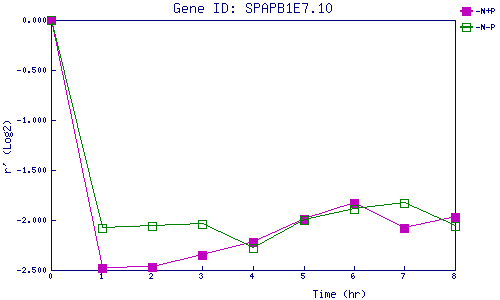
| 0 | 1 | 2 | 3 | 4 | 5 | 6 | 7 | 8 | |
| -N+P | 0.000 | -2.481 | -2.469 | -2.353 | -2.225 | -1.989 | -1.831 | -2.076 | -1.967 |
| -N-P | 0.000 | -2.083 | -2.064 | -2.037 | -2.283 | -2.003 | -1.886 | -1.831 | -2.055 |
|
-N+P: Nitrogen starved in the presence of P-factor -N-P: Nitrogen starved in the absence of P-factor |