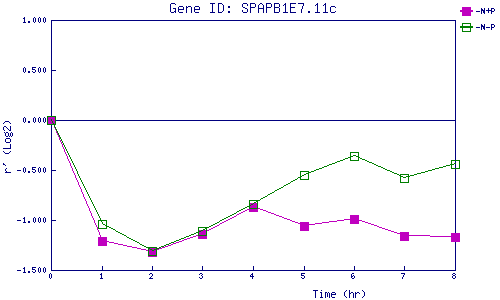
| 0 | 1 | 2 | 3 | 4 | 5 | 6 | 7 | 8 | |
| -N+P | 0.000 | -1.210 | -1.316 | -1.142 | -0.869 | -1.058 | -0.990 | -1.159 | -1.168 |
| -N-P | 0.000 | -1.044 | -1.310 | -1.109 | -0.845 | -0.552 | -0.364 | -0.577 | -0.445 |
|
-N+P: Nitrogen starved in the presence of P-factor -N-P: Nitrogen starved in the absence of P-factor |