rps6-2 rps602 rps6
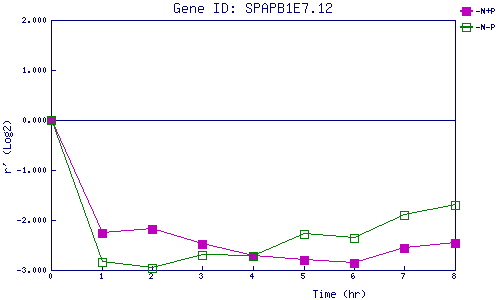
| 0 | 1 | 2 | 3 | 4 | 5 | 6 | 7 | 8 | |
| -N+P | 0.000 | -2.261 | -2.180 | -2.481 | -2.724 | -2.798 | -2.856 | -2.554 | -2.467 |
| -N-P | 0.000 | -2.836 | -2.960 | -2.693 | -2.720 | -2.280 | -2.362 | -1.900 | -1.693 |
|
-N+P: Nitrogen starved in the presence of P-factor -N-P: Nitrogen starved in the absence of P-factor |