| 0 | 1 | 2 | 3 | 4 | 5 | 6 | 7 | 8 | |
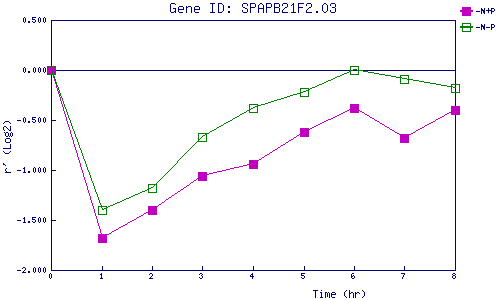
| -N+P | 0.000 | -1.676 | -1.399 | -1.055 | -0.936 | -0.616 | -0.382 | -0.684 | -0.401 |
| -N-P | 0.000 | -1.403 | -1.184 | -0.672 | -0.380 | -0.221 | -0.005 | -0.089 | -0.183 |
|
-N+P: Nitrogen starved in the presence of P-factor -N-P: Nitrogen starved in the absence of P-factor |