| 0 | 1 | 2 | 3 | 4 | 5 | 6 | 7 | 8 | |
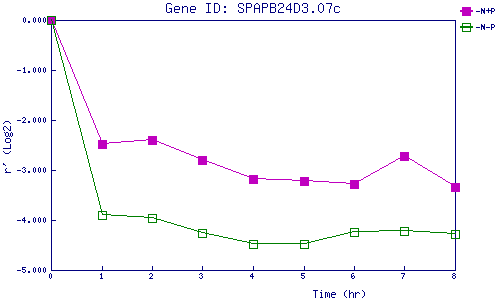
| -N+P | 0.000 | -2.480 | -2.403 | -2.800 | -3.180 | -3.221 | -3.283 | -2.721 | -3.335 |
| -N-P | 0.000 | -3.907 | -3.954 | -4.267 | -4.487 | -4.473 | -4.246 | -4.223 | -4.283 |
|
-N+P: Nitrogen starved in the presence of P-factor -N-P: Nitrogen starved in the absence of P-factor |