cig2 cyc17
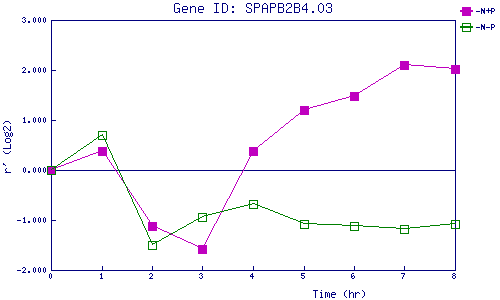
| 0 | 1 | 2 | 3 | 4 | 5 | 6 | 7 | 8 | |
| -N+P | 0.000 | 0.383 | -1.110 | -1.574 | 0.380 | 1.200 | 1.477 | 2.107 | 2.024 |
| -N-P | 0.000 | 0.691 | -1.509 | -0.943 | -0.690 | -1.079 | -1.113 | -1.184 | -1.081 |
|
-N+P: Nitrogen starved in the presence of P-factor -N-P: Nitrogen starved in the absence of P-factor |