rpl3-b rpl302 rpl3-2
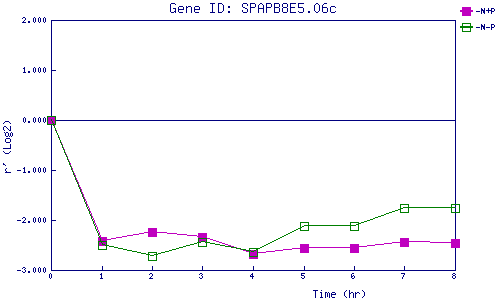
| 0 | 1 | 2 | 3 | 4 | 5 | 6 | 7 | 8 | |
| -N+P | 0.000 | -2.411 | -2.243 | -2.334 | -2.673 | -2.569 | -2.557 | -2.447 | -2.465 |
| -N-P | 0.000 | -2.501 | -2.710 | -2.438 | -2.630 | -2.110 | -2.125 | -1.751 | -1.764 |
|
-N+P: Nitrogen starved in the presence of P-factor -N-P: Nitrogen starved in the absence of P-factor |