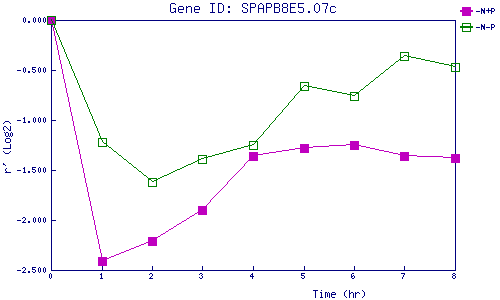
| 0 | 1 | 2 | 3 | 4 | 5 | 6 | 7 | 8 | |
| -N+P | 0.000 | -2.406 | -2.213 | -1.904 | -1.361 | -1.276 | -1.251 | -1.359 | -1.377 |
| -N-P | 0.000 | -1.219 | -1.617 | -1.387 | -1.252 | -0.664 | -0.757 | -0.355 | -0.471 |
|
-N+P: Nitrogen starved in the presence of P-factor -N-P: Nitrogen starved in the absence of P-factor |