| 0 | 1 | 2 | 3 | 4 | 5 | 6 | 7 | 8 | |
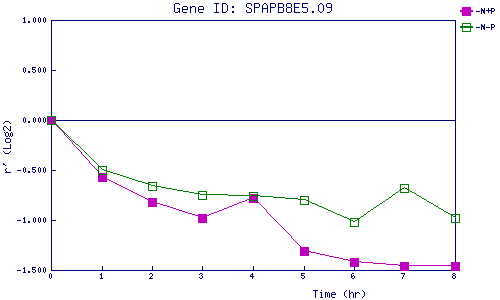
| -N+P | 0.000 | -0.570 | -0.825 | -0.983 | -0.779 | -1.310 | -1.423 | -1.462 | -1.464 |
| -N-P | 0.000 | -0.502 | -0.657 | -0.749 | -0.762 | -0.801 | -1.024 | -0.679 | -0.982 |
|
-N+P: Nitrogen starved in the presence of P-factor -N-P: Nitrogen starved in the absence of P-factor |