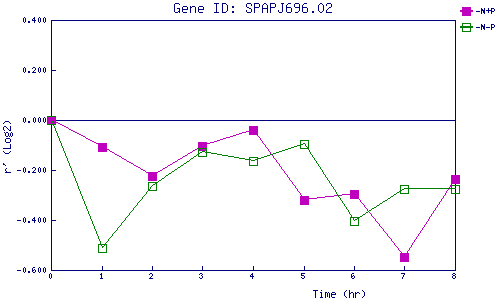
| 0 | 1 | 2 | 3 | 4 | 5 | 6 | 7 | 8 | |
| -N+P | 0.000 | -0.109 | -0.222 | -0.105 | -0.040 | -0.319 | -0.298 | -0.548 | -0.237 |
| -N-P | 0.000 | -0.514 | -0.264 | -0.126 | -0.165 | -0.095 | -0.404 | -0.277 | -0.275 |
|
-N+P: Nitrogen starved in the presence of P-factor -N-P: Nitrogen starved in the absence of P-factor |