rfc3
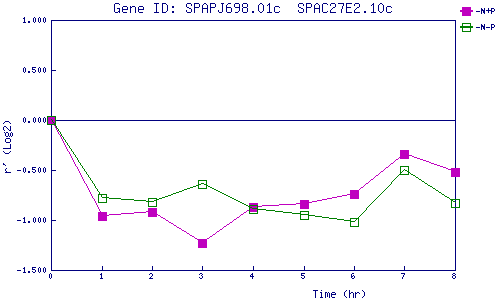
| 0 | 1 | 2 | 3 | 4 | 5 | 6 | 7 | 8 | |
| -N+P | 0.000 | -0.963 | -0.919 | -1.229 | -0.874 | -0.845 | -0.744 | -0.339 | -0.517 |
| -N-P | 0.000 | -0.777 | -0.820 | -0.636 | -0.887 | -0.950 | -1.023 | -0.502 | -0.834 |
|
-N+P: Nitrogen starved in the presence of P-factor -N-P: Nitrogen starved in the absence of P-factor |