rpsa-2 rps0-2 rps002
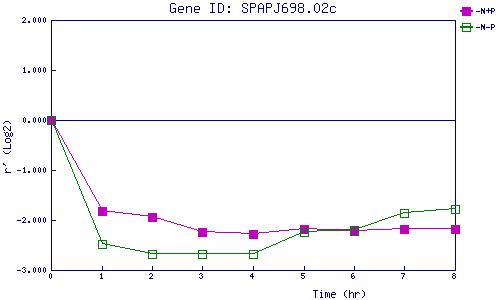
| 0 | 1 | 2 | 3 | 4 | 5 | 6 | 7 | 8 | |
| -N+P | 0.000 | -1.817 | -1.946 | -2.236 | -2.276 | -2.187 | -2.216 | -2.172 | -2.181 |
| -N-P | 0.000 | -2.471 | -2.675 | -2.678 | -2.677 | -2.249 | -2.199 | -1.869 | -1.783 |
|
-N+P: Nitrogen starved in the presence of P-factor -N-P: Nitrogen starved in the absence of P-factor |