prp12 sap130
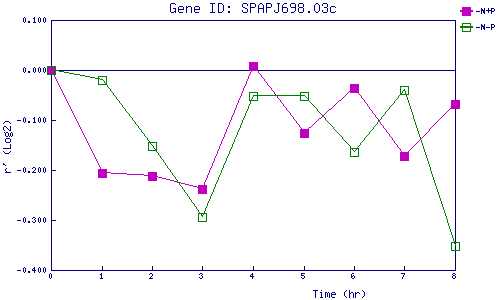
| 0 | 1 | 2 | 3 | 4 | 5 | 6 | 7 | 8 | |
| -N+P | 0.000 | -0.206 | -0.212 | -0.238 | 0.009 | -0.126 | -0.035 | -0.172 | -0.067 |
| -N-P | 0.000 | -0.021 | -0.151 | -0.294 | -0.051 | -0.052 | -0.163 | -0.039 | -0.351 |
|
-N+P: Nitrogen starved in the presence of P-factor -N-P: Nitrogen starved in the absence of P-factor |