rif1 tap11
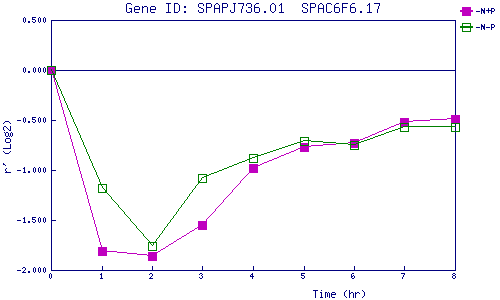
| 0 | 1 | 2 | 3 | 4 | 5 | 6 | 7 | 8 | |
| -N+P | 0.000 | -1.813 | -1.861 | -1.550 | -0.985 | -0.772 | -0.731 | -0.516 | -0.487 |
| -N-P | 0.000 | -1.179 | -1.762 | -1.084 | -0.876 | -0.711 | -0.750 | -0.574 | -0.571 |
|
-N+P: Nitrogen starved in the presence of P-factor -N-P: Nitrogen starved in the absence of P-factor |