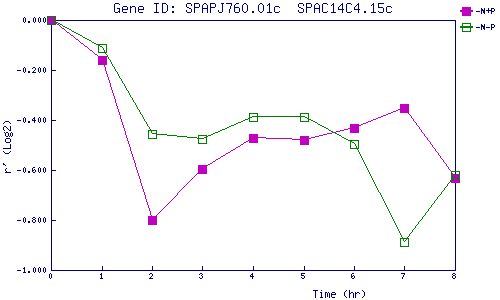
| 0 | 1 | 2 | 3 | 4 | 5 | 6 | 7 | 8 | |
| -N+P | 0.000 | -0.158 | -0.800 | -0.597 | -0.471 | -0.480 | -0.432 | -0.353 | -0.633 |
| -N-P | 0.000 | -0.111 | -0.458 | -0.475 | -0.387 | -0.388 | -0.494 | -0.890 | -0.619 |
|
-N+P: Nitrogen starved in the presence of P-factor -N-P: Nitrogen starved in the absence of P-factor |