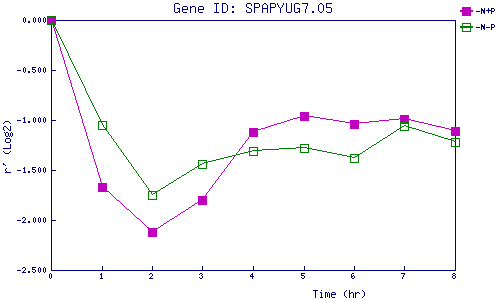
| 0 | 1 | 2 | 3 | 4 | 5 | 6 | 7 | 8 | |
| -N+P | 0.000 | -1.667 | -2.122 | -1.802 | -1.118 | -0.965 | -1.037 | -0.993 | -1.114 |
| -N-P | 0.000 | -1.052 | -1.753 | -1.444 | -1.314 | -1.277 | -1.379 | -1.063 | -1.224 |
|
-N+P: Nitrogen starved in the presence of P-factor -N-P: Nitrogen starved in the absence of P-factor |