ada1
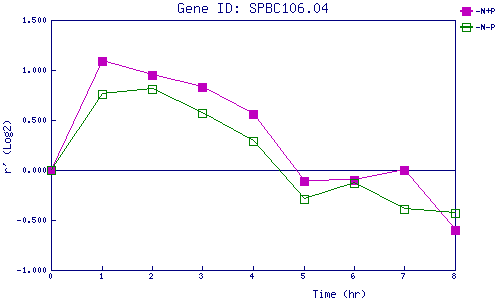
| 0 | 1 | 2 | 3 | 4 | 5 | 6 | 7 | 8 | |
| -N+P | 0.000 | 1.092 | 0.947 | 0.829 | 0.558 | -0.108 | -0.098 | -0.005 | -0.599 |
| -N-P | 0.000 | 0.755 | 0.811 | 0.574 | 0.287 | -0.287 | -0.126 | -0.390 | -0.427 |
|
-N+P: Nitrogen starved in the presence of P-factor -N-P: Nitrogen starved in the absence of P-factor |