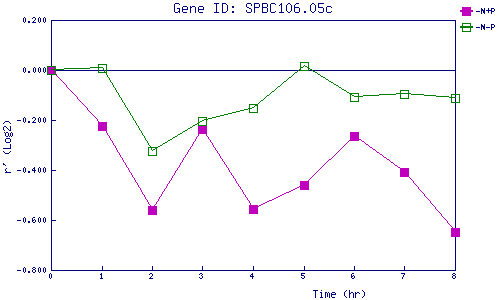
| 0 | 1 | 2 | 3 | 4 | 5 | 6 | 7 | 8 | |
| -N+P | 0.000 | -0.225 | -0.559 | -0.237 | -0.556 | -0.460 | -0.262 | -0.408 | -0.647 |
| -N-P | 0.000 | 0.006 | -0.325 | -0.205 | -0.152 | 0.015 | -0.107 | -0.095 | -0.112 |
|
-N+P: Nitrogen starved in the presence of P-factor -N-P: Nitrogen starved in the absence of P-factor |