cct4
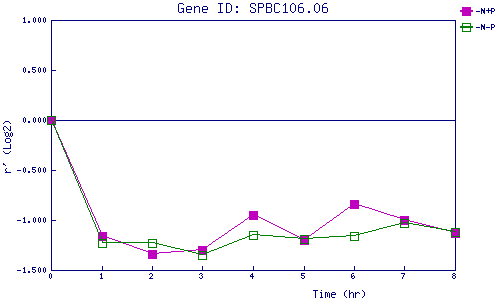
| 0 | 1 | 2 | 3 | 4 | 5 | 6 | 7 | 8 | |
| -N+P | 0.000 | -1.160 | -1.343 | -1.296 | -0.953 | -1.199 | -0.839 | -0.998 | -1.129 |
| -N-P | 0.000 | -1.229 | -1.227 | -1.346 | -1.150 | -1.188 | -1.163 | -1.032 | -1.124 |
|
-N+P: Nitrogen starved in the presence of P-factor -N-P: Nitrogen starved in the absence of P-factor |