pka1 tpk git6
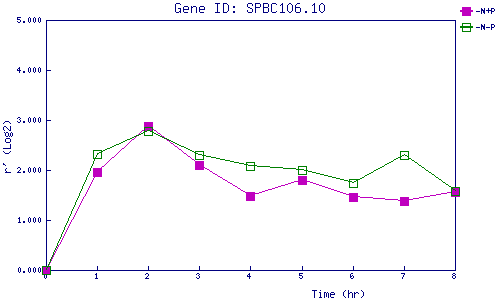
| 0 | 1 | 2 | 3 | 4 | 5 | 6 | 7 | 8 | |
| -N+P | 0.000 | 1.966 | 2.881 | 2.091 | 1.480 | 1.808 | 1.466 | 1.383 | 1.558 |
| -N-P | 0.000 | 2.327 | 2.782 | 2.295 | 2.072 | 2.002 | 1.742 | 2.293 | 1.582 |
|
-N+P: Nitrogen starved in the presence of P-factor -N-P: Nitrogen starved in the absence of P-factor |