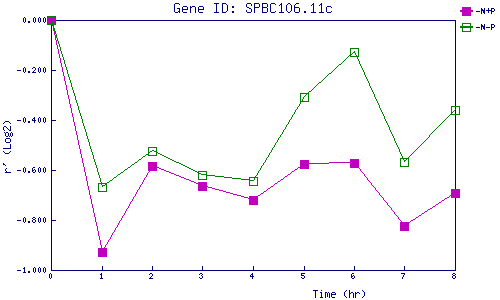
| 0 | 1 | 2 | 3 | 4 | 5 | 6 | 7 | 8 | |
| -N+P | 0.000 | -0.926 | -0.584 | -0.664 | -0.719 | -0.574 | -0.571 | -0.823 | -0.691 |
| -N-P | 0.000 | -0.668 | -0.523 | -0.621 | -0.644 | -0.307 | -0.127 | -0.566 | -0.358 |
|
-N+P: Nitrogen starved in the presence of P-factor -N-P: Nitrogen starved in the absence of P-factor |