| 0 | 1 | 2 | 3 | 4 | 5 | 6 | 7 | 8 | |
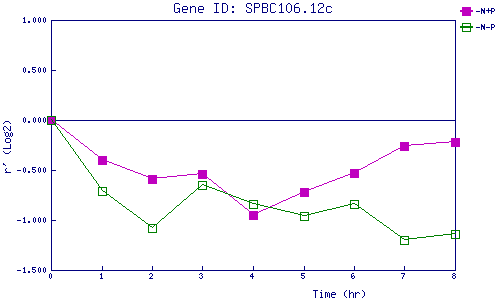
| -N+P | 0.000 | -0.397 | -0.594 | -0.538 | -0.948 | -0.718 | -0.530 | -0.262 | -0.222 |
| -N-P | 0.000 | -0.707 | -1.079 | -0.647 | -0.836 | -0.955 | -0.835 | -1.198 | -1.140 |
|
-N+P: Nitrogen starved in the presence of P-factor -N-P: Nitrogen starved in the absence of P-factor |