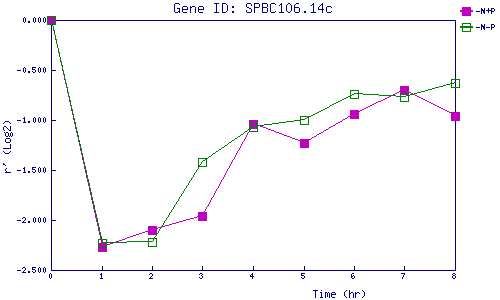
| 0 | 1 | 2 | 3 | 4 | 5 | 6 | 7 | 8 | |
| -N+P | 0.000 | -2.271 | -2.095 | -1.961 | -1.036 | -1.234 | -0.935 | -0.699 | -0.964 |
| -N-P | 0.000 | -2.227 | -2.221 | -1.420 | -1.072 | -0.997 | -0.743 | -0.774 | -0.627 |
|
-N+P: Nitrogen starved in the presence of P-factor -N-P: Nitrogen starved in the absence of P-factor |