idi1
| 0 | 1 | 2 | 3 | 4 | 5 | 6 | 7 | 8 | |
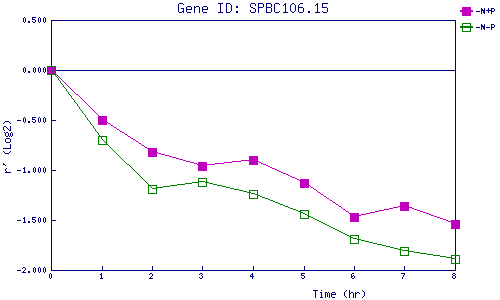
| -N+P | 0.000 | -0.502 | -0.820 | -0.957 | -0.902 | -1.126 | -1.474 | -1.359 | -1.540 |
| -N-P | 0.000 | -0.701 | -1.192 | -1.125 | -1.238 | -1.438 | -1.687 | -1.809 | -1.894 |
|
-N+P: Nitrogen starved in the presence of P-factor -N-P: Nitrogen starved in the absence of P-factor |
