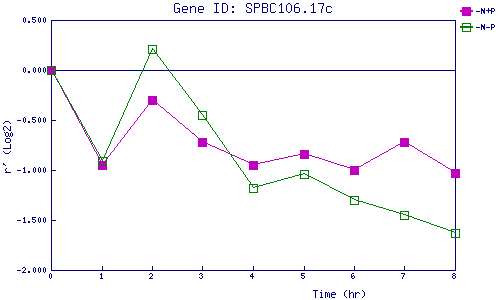
| 0 | 1 | 2 | 3 | 4 | 5 | 6 | 7 | 8 | |
| -N+P | 0.000 | -0.954 | -0.296 | -0.719 | -0.947 | -0.841 | -1.003 | -0.717 | -1.028 |
| -N-P | 0.000 | -0.911 | 0.213 | -0.448 | -1.181 | -1.045 | -1.301 | -1.450 | -1.631 |
|
-N+P: Nitrogen starved in the presence of P-factor -N-P: Nitrogen starved in the absence of P-factor |