rpl25a
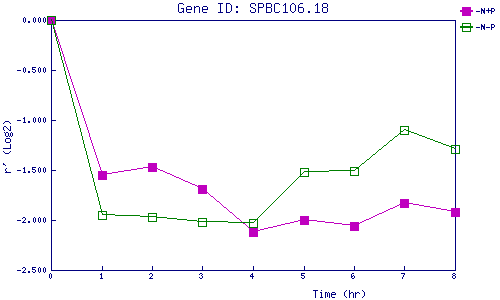
| 0 | 1 | 2 | 3 | 4 | 5 | 6 | 7 | 8 | |
| -N+P | 0.000 | -1.554 | -1.466 | -1.687 | -2.122 | -2.001 | -2.062 | -1.830 | -1.921 |
| -N-P | 0.000 | -1.953 | -1.970 | -2.015 | -2.033 | -1.518 | -1.506 | -1.103 | -1.294 |
|
-N+P: Nitrogen starved in the presence of P-factor -N-P: Nitrogen starved in the absence of P-factor |