lys4
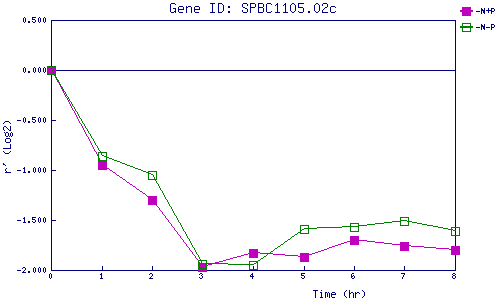
| 0 | 1 | 2 | 3 | 4 | 5 | 6 | 7 | 8 | |
| -N+P | 0.000 | -0.951 | -1.298 | -1.971 | -1.828 | -1.873 | -1.703 | -1.762 | -1.805 |
| -N-P | 0.000 | -0.856 | -1.050 | -1.944 | -1.952 | -1.590 | -1.572 | -1.509 | -1.612 |
|
-N+P: Nitrogen starved in the presence of P-factor -N-P: Nitrogen starved in the absence of P-factor |