abp1 cbp1
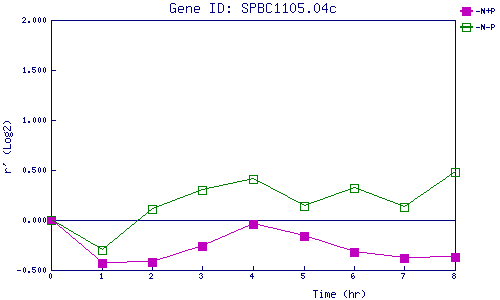
| 0 | 1 | 2 | 3 | 4 | 5 | 6 | 7 | 8 | |
| -N+P | 0.000 | -0.427 | -0.415 | -0.262 | -0.043 | -0.158 | -0.322 | -0.375 | -0.373 |
| -N-P | 0.000 | -0.299 | 0.108 | 0.303 | 0.409 | 0.142 | 0.319 | 0.129 | 0.475 |
|
-N+P: Nitrogen starved in the presence of P-factor -N-P: Nitrogen starved in the absence of P-factor |