pmc4
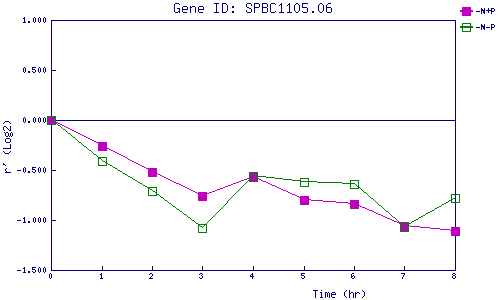
| 0 | 1 | 2 | 3 | 4 | 5 | 6 | 7 | 8 | |
| -N+P | 0.000 | -0.263 | -0.521 | -0.759 | -0.567 | -0.803 | -0.838 | -1.059 | -1.109 |
| -N-P | 0.000 | -0.411 | -0.707 | -1.085 | -0.560 | -0.625 | -0.643 | -1.071 | -0.775 |
|
-N+P: Nitrogen starved in the presence of P-factor -N-P: Nitrogen starved in the absence of P-factor |