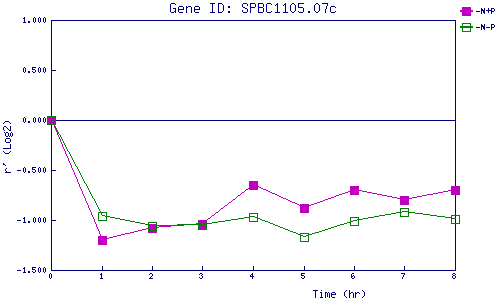
| 0 | 1 | 2 | 3 | 4 | 5 | 6 | 7 | 8 | |
| -N+P | 0.000 | -1.202 | -1.077 | -1.037 | -0.653 | -0.876 | -0.696 | -0.800 | -0.698 |
| -N-P | 0.000 | -0.960 | -1.055 | -1.048 | -0.970 | -1.170 | -1.015 | -0.921 | -0.994 |
|
-N+P: Nitrogen starved in the presence of P-factor -N-P: Nitrogen starved in the absence of P-factor |