ubc15
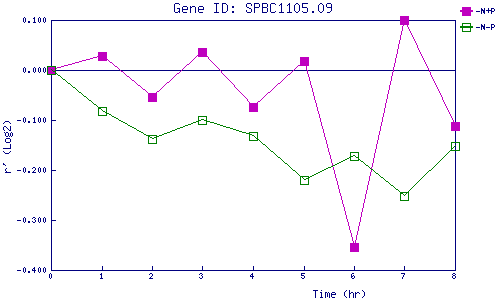
| 0 | 1 | 2 | 3 | 4 | 5 | 6 | 7 | 8 | |
| -N+P | 0.000 | 0.028 | -0.054 | 0.037 | -0.074 | 0.018 | -0.354 | 0.100 | -0.113 |
| -N-P | 0.000 | -0.082 | -0.138 | -0.099 | -0.133 | -0.221 | -0.172 | -0.252 | -0.152 |
|
-N+P: Nitrogen starved in the presence of P-factor -N-P: Nitrogen starved in the absence of P-factor |