hhf3 h4.3
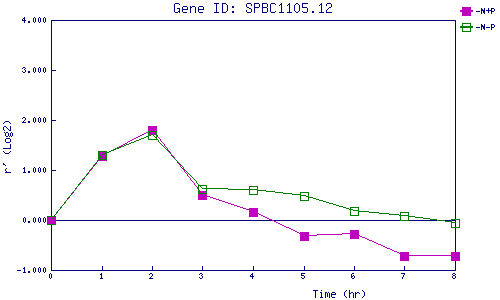
| 0 | 1 | 2 | 3 | 4 | 5 | 6 | 7 | 8 | |
| -N+P | 0.000 | 1.276 | 1.806 | 0.507 | 0.155 | -0.314 | -0.279 | -0.724 | -0.715 |
| -N-P | 0.000 | 1.296 | 1.709 | 0.616 | 0.594 | 0.470 | 0.179 | 0.070 | -0.067 |
|
-N+P: Nitrogen starved in the presence of P-factor -N-P: Nitrogen starved in the absence of P-factor |