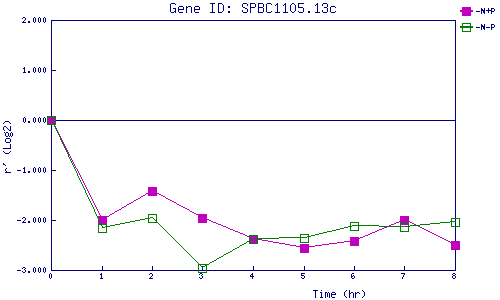
| 0 | 1 | 2 | 3 | 4 | 5 | 6 | 7 | 8 | |
| -N+P | 0.000 | -1.994 | -1.413 | -1.956 | -2.381 | -2.550 | -2.428 | -2.007 | -2.504 |
| -N-P | 0.000 | -2.169 | -1.964 | -2.952 | -2.386 | -2.366 | -2.113 | -2.140 | -2.035 |
|
-N+P: Nitrogen starved in the presence of P-factor -N-P: Nitrogen starved in the absence of P-factor |