| 0 | 1 | 2 | 3 | 4 | 5 | 6 | 7 | 8 | |
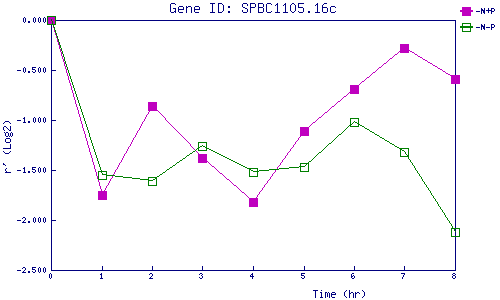
| -N+P | 0.000 | -1.747 | -0.858 | -1.380 | -1.818 | -1.110 | -0.690 | -0.282 | -0.594 |
| -N-P | 0.000 | -1.548 | -1.608 | -1.256 | -1.523 | -1.466 | -1.019 | -1.316 | -2.118 |
|
-N+P: Nitrogen starved in the presence of P-factor -N-P: Nitrogen starved in the absence of P-factor |