cnp1 sim2
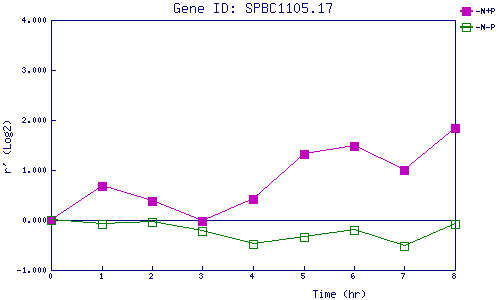
| 0 | 1 | 2 | 3 | 4 | 5 | 6 | 7 | 8 | |
| -N+P | 0.000 | 0.671 | 0.382 | -0.023 | 0.421 | 1.310 | 1.487 | 1.008 | 1.850 |
| -N-P | 0.000 | -0.084 | -0.043 | -0.229 | -0.487 | -0.338 | -0.198 | -0.529 | -0.086 |
|
-N+P: Nitrogen starved in the presence of P-factor -N-P: Nitrogen starved in the absence of P-factor |