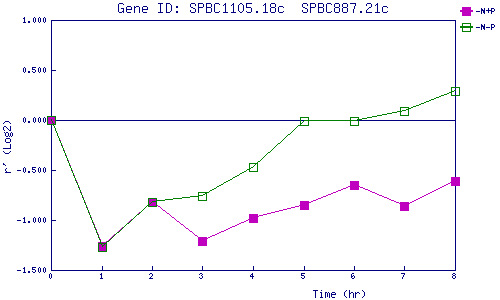
| 0 | 1 | 2 | 3 | 4 | 5 | 6 | 7 | 8 | |
| -N+P | 0.000 | -1.261 | -0.817 | -1.206 | -0.976 | -0.847 | -0.652 | -0.856 | -0.612 |
| -N-P | 0.000 | -1.267 | -0.824 | -0.762 | -0.473 | -0.014 | -0.011 | 0.091 | 0.291 |
|
-N+P: Nitrogen starved in the presence of P-factor -N-P: Nitrogen starved in the absence of P-factor |