| 0 | 1 | 2 | 3 | 4 | 5 | 6 | 7 | 8 | |
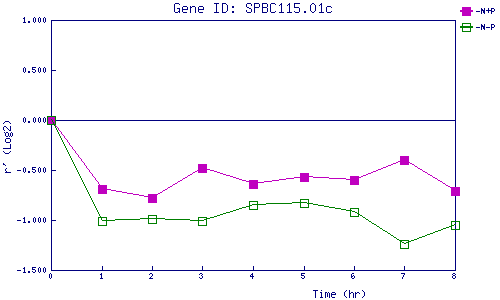
| -N+P | 0.000 | -0.687 | -0.783 | -0.481 | -0.636 | -0.567 | -0.601 | -0.404 | -0.708 |
| -N-P | 0.000 | -1.013 | -0.986 | -1.013 | -0.854 | -0.831 | -0.918 | -1.237 | -1.052 |
|
-N+P: Nitrogen starved in the presence of P-factor -N-P: Nitrogen starved in the absence of P-factor |