ubc4
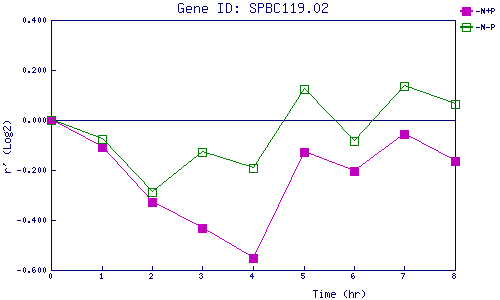
| 0 | 1 | 2 | 3 | 4 | 5 | 6 | 7 | 8 | |
| -N+P | 0.000 | -0.108 | -0.326 | -0.431 | -0.552 | -0.130 | -0.203 | -0.056 | -0.163 |
| -N-P | 0.000 | -0.077 | -0.286 | -0.129 | -0.192 | 0.124 | -0.084 | 0.136 | 0.063 |
|
-N+P: Nitrogen starved in the presence of P-factor -N-P: Nitrogen starved in the absence of P-factor |