mei3
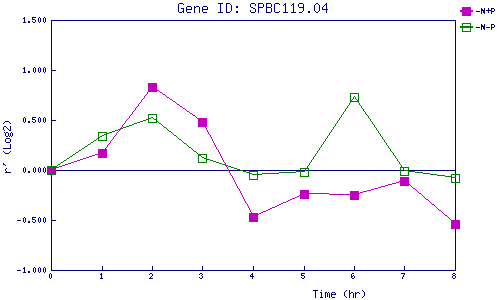
| 0 | 1 | 2 | 3 | 4 | 5 | 6 | 7 | 8 | |
| -N+P | 0.000 | 0.168 | 0.828 | 0.484 | -0.471 | -0.240 | -0.250 | -0.109 | -0.538 |
| -N-P | 0.000 | 0.335 | 0.515 | 0.118 | -0.053 | -0.017 | 0.732 | -0.007 | -0.079 |
|
-N+P: Nitrogen starved in the presence of P-factor -N-P: Nitrogen starved in the absence of P-factor |