sco1
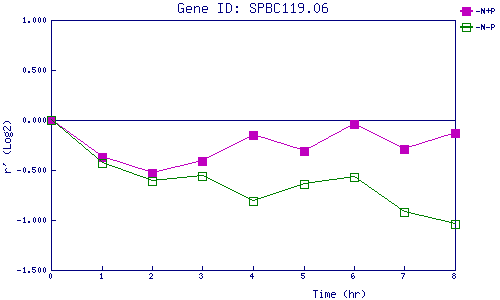
| 0 | 1 | 2 | 3 | 4 | 5 | 6 | 7 | 8 | |
| -N+P | 0.000 | -0.372 | -0.532 | -0.409 | -0.151 | -0.308 | -0.035 | -0.289 | -0.128 |
| -N-P | 0.000 | -0.434 | -0.606 | -0.562 | -0.807 | -0.635 | -0.570 | -0.917 | -1.037 |
|
-N+P: Nitrogen starved in the presence of P-factor -N-P: Nitrogen starved in the absence of P-factor |