spm1 pmk1
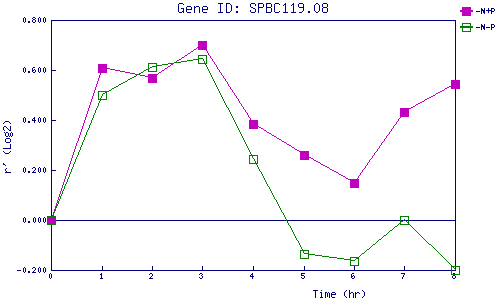
| 0 | 1 | 2 | 3 | 4 | 5 | 6 | 7 | 8 | |
| -N+P | 0.000 | 0.608 | 0.567 | 0.701 | 0.383 | 0.259 | 0.149 | 0.434 | 0.542 |
| -N-P | 0.000 | 0.501 | 0.612 | 0.645 | 0.244 | -0.138 | -0.164 | 0.001 | -0.200 |
|
-N+P: Nitrogen starved in the presence of P-factor -N-P: Nitrogen starved in the absence of P-factor |