pac1 hcs
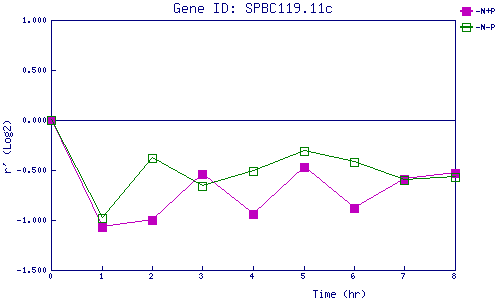
| 0 | 1 | 2 | 3 | 4 | 5 | 6 | 7 | 8 | |
| -N+P | 0.000 | -1.072 | -0.996 | -0.539 | -0.937 | -0.471 | -0.884 | -0.589 | -0.530 |
| -N-P | 0.000 | -0.981 | -0.375 | -0.664 | -0.513 | -0.307 | -0.423 | -0.595 | -0.571 |
|
-N+P: Nitrogen starved in the presence of P-factor -N-P: Nitrogen starved in the absence of P-factor |