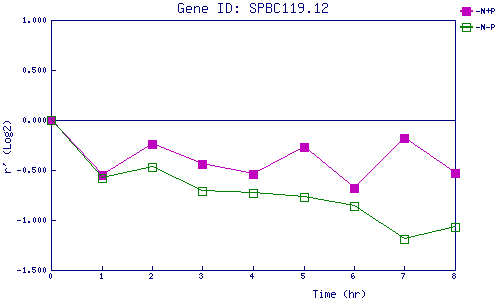
| 0 | 1 | 2 | 3 | 4 | 5 | 6 | 7 | 8 | |
| -N+P | 0.000 | -0.551 | -0.244 | -0.435 | -0.537 | -0.266 | -0.684 | -0.178 | -0.527 |
| -N-P | 0.000 | -0.585 | -0.472 | -0.713 | -0.731 | -0.766 | -0.863 | -1.189 | -1.068 |
|
-N+P: Nitrogen starved in the presence of P-factor -N-P: Nitrogen starved in the absence of P-factor |