prp31
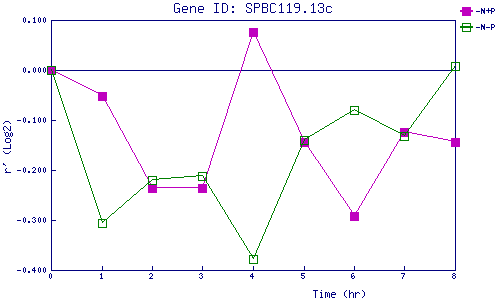
| 0 | 1 | 2 | 3 | 4 | 5 | 6 | 7 | 8 | |
| -N+P | 0.000 | -0.051 | -0.237 | -0.235 | 0.077 | -0.145 | -0.291 | -0.124 | -0.145 |
| -N-P | 0.000 | -0.306 | -0.219 | -0.211 | -0.378 | -0.141 | -0.081 | -0.133 | 0.009 |
|
-N+P: Nitrogen starved in the presence of P-factor -N-P: Nitrogen starved in the absence of P-factor |