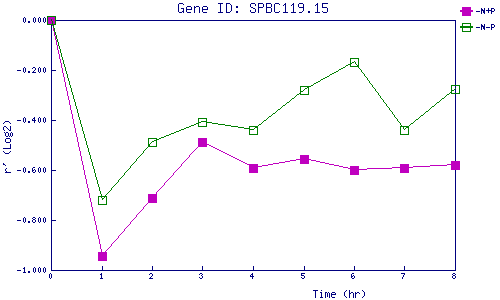
| 0 | 1 | 2 | 3 | 4 | 5 | 6 | 7 | 8 | |
| -N+P | 0.000 | -0.943 | -0.711 | -0.486 | -0.592 | -0.556 | -0.602 | -0.590 | -0.580 |
| -N-P | 0.000 | -0.719 | -0.488 | -0.409 | -0.438 | -0.282 | -0.167 | -0.440 | -0.276 |
|
-N+P: Nitrogen starved in the presence of P-factor -N-P: Nitrogen starved in the absence of P-factor |